 Despite seasonal changes, home prices continued their upward trend in October 2015.
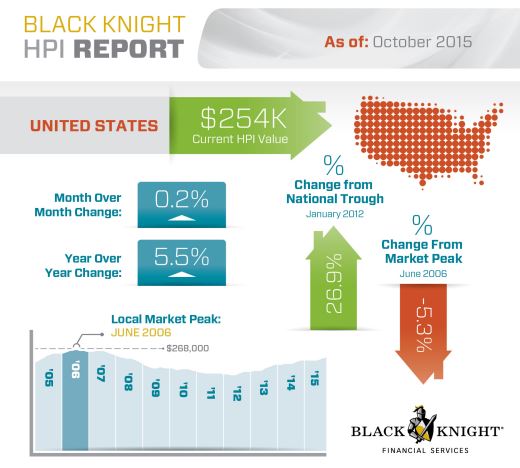
Black Knight Financial Services' Data and Analytics division released its October 2015 Home Price Index(HPI) report, finding that U.S. home prices rose marginally by 0.2 percent in October.
However, despite the relatively small month-over-month increase, home prices are up 5.5 percent year-over-year.
The HPI reached $254,000 in October and is now just 5.3 percent off its June 2006 peak of $268,000. In addition, the HPI is up over 26.9 percent from the market's bottom in January 2012.
Leading the gains among the states for the fourth consecutive month in October 2015 is New York with a 1.1 percent month-over-month home price increase. Wrapping up the top five states with the largest monthly HPI changes are Nevada (0.8 percent); Utah (0.8 percent); South Carolina (0.7 percent); and New Jersey (0.7 percent).
In October, Black Knight reported that Connecticut once again saw the most negative movement, as home prices declined 0.6 percent month-over-month. Minnesota (-0.5 percent); Ohio (-0.3 percent); California (-0.2 percent); and Missouri (-0.2 percent) followed with negative home price appreciation.
New York City, New York and Reno, Nevada led the metros with the largest home prices gains, with prices increasing 1.2 percent in October, according to the report. Sebastian, Florida (1.0 percent); Cape Coral, Florida (1.0 percent); and Carson City, Nevada (1.0 percent) wrapped up the top five metros with the largest home price appreciation.
 On the other hand, Bakersfield, California (-0.9 percent); Bridgeport, Connecticut (-0.8 percent); Norwich, Connecticut (-0.7 percent); Atlantic City, New Jersey (-0.6 percent); and Cleveland, Ohio (-0.6 percent) held the top five positions of metros with the largest home price declines.
The data also showed that all five California metro areas were among the nation's 40 largest saw home prices fall in October, as the state did as a whole.
The data showed that New York, Tennessee, and Texas all hit new home price peaks again in October at $356,000, $178,000, and $216,000, respectively.
Seven of the nation's 40 largest metros reached new peaks in October including Austin, Texas ($286,000); Dallas, Texas ($220,000); Denver, Colorado ($328,000); Houston, Texas ($220,000); Nashville, Tennessee ($220,000); Portland, Oregon ($322,000); and San Antonio, Texas ($196,000).
