
Third-Party Service Providers Progressing Despite Intense Regulatory Scrutiny #realestate #housing #success


The last several years have been painful for many of the third-party service providers to the mortgage loan industry. The OCC Bulletin 2013-29, CFPBBulletin 2012-03, and Federal Consent Orders represent only a few of the significant regulatory impacts on these service providers and the mortgage industry. With all of the oversight scrutiny, there has been progress made.
Overall, across all vendor types, we have seen a 74 percent improvement in the number of high risk items identified in operational audits conducted. This results in a 13 percent improvement in risk score of the vending group. Audits conducted are presented in three categories: Operations and Management, Security and Privacy and Case Management. In these three categories, we have seen a 49 percent improvement in the category of Operations and Management, Security and Privacy brings a 36 percent improvement and Case Management reflects a 5.25 percent degredation in performance. Since case management and performance carries the highest weight in the risk scoring, any degredation in the case performance has a higher impact on the overall risk score.
Most of the loan servicing vendor work is fairly low margin business so it could appear that improvements found in the areas of operations, management, security and privacy may be at the expense of case performance, which may not be the best result for the industry and its consumer base. At this time, our observation is that the third party service providers are in much better position with regards to how policies and procedures are documented, they have established documented financial controls, capacity management, and they have improvements in the controls that exist to protect consumer information and business continuity.
It is very important that in this era of ever-increasing scrutiny that while we are ensuring we have solid documented controls in order to meet the regulatory requirements put forth, we have to make sure that the quality and performance of the actual work product remains at a high level.
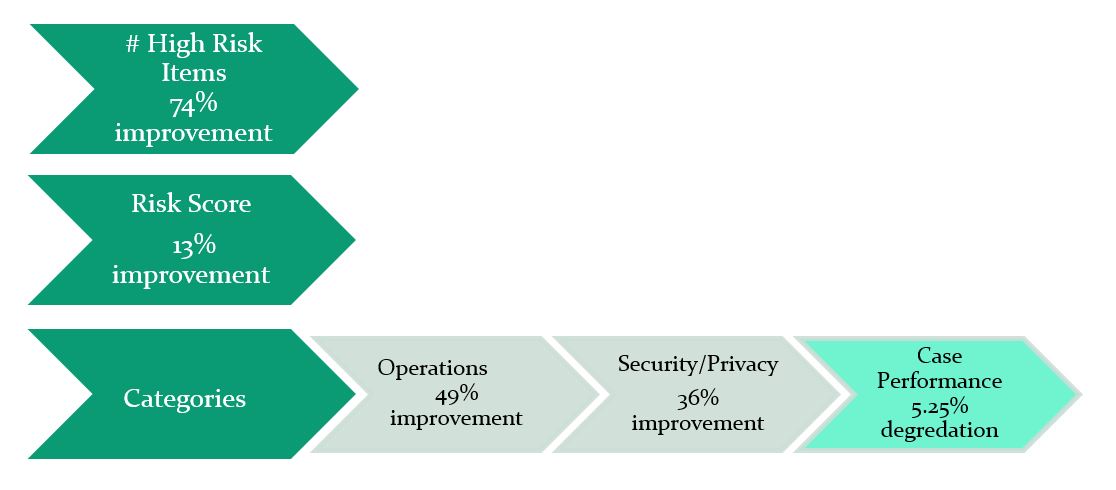
12-1 Springboard graph

Popular posts from this blog

Grass Seed Video

When Will Bank Foreclosurews ‘Normalize’? Team Thayer #realestate #investor #housing #market #news #oregon

With much of the talk surrounding the housing market centered on “normalization” or returning to its pre-crisis state, one metric which the market is watching is the distressed sales share—the share of REO and short sales that comprise total residential home sales. For February 2016, the distressed sales share declined by 2.9 percentage points over-the-year (and 0.4 percentage points over-the month) down to 11 percent, according to  data released by CoreLogic  on Thursday. At their peak in January 2009, distressed sales accounted for nearly one-third of all residential home sales (32.4 percent) but has been declining steadily since then. By comparison, the pre-crisis share of distressed sales was typically around 2 percent; CoreLogic estimates that if the current rate of year-over-year decline continues, the distressed sales share will reach the “normal” pre-crisis level in slightly more than two years. “Prior to the housing crash, the distressed share of total...

Bankruptcy Filings Dip Even Lower! Team Thayer #realestate #housing #market #investor #News #oregon

Bankruptcy Filings Dip Lower Nationwide bankruptcy filings were 5 percent lower in October 2016 compared with a year earlier, falling even lower than last month’s reported decrease, according to October 2016 AACER bankruptcy data reported by Epiq Systems. Bankruptcy filings totaled 63,042 in October, which was an increase from September’s total of 64,614, and was approximately 2.4 percent higher than October 2015’s total of 63,042 (an increase of 1,572).  Year-to-date, there have been 656,125 bankruptcy filings nationwide for the past nine months of 2016 (about 65,613 per month), down from 2015’s year-to-date total through the end of October of 700,014 (about 70,001 per month). The average number of filings per day in October 2016 was 3,152 over 20 days, which is an increase from September’s daily average of 3,077 over 21 days. The extra filing day in September compared to October accounts for the slight increase in the number of filings in September; had October feature...