 While delaying foreclosure on a home does have some potential benefits, for the most part it is counterproductive, according to data released this week by Freddie Mac.
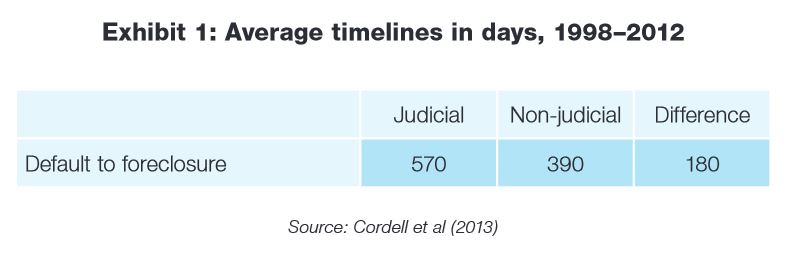
In Freddie Mac’s November 2015 Insight & Outlook report, the Enterprise notes the time it takes to foreclose on a home is twice as long on the average in judicial foreclosure states, meaning that the courts must approve the process before it is completed, as opposed to non-judicial states, where the process can be completed without the courts. The state with the longest average time to complete foreclosure (from the date of initial default) was a judicial foreclosure state, New Jersey, at 22 months—which was twice as long as the shortest average foreclosure timeline, 11 months, in two non-judicial states, Michigan and Missouri. In some judicial states the foreclosure process can take much longer than 22 months, such as in Ohio, where a bill recently passed in the State House of Representatives that would expedite the foreclosure timeline to as low as six months.
Freddie Mac notes that sometimes that a delay in the foreclosure process can potentially be useful. It can buy time for the borrower to either cure the delinquency or work out a loan modification. If foreclosure cannot be avoided, the borrowers may be able to use the extra time to work out a home forfeiture solution such as a short sale or deed-in-lieu of foreclosure agreement.
Despite the potential benefits of the extra time, however, delaying foreclosure can ultimately be counterproductive, according to Freddie Mac. Borrowers who are delinquent and facing foreclosure will sometimes desert the home, thus deferring maintenance. A deteriorating home increases losses incurred by the mortgagee and also can potentially breed more blight—resulting in squatting, vandalism, violent crime, and the deterioration of entire communities.
 “Even if the house is maintained properly, delay by itself increases losses to lenders,” Freddie Mac said. “The cost to service non-performing loans is 15 times higher than the cost to service performing loans. And, if loans are securitized, servicers typically must advance interest payments to investors and make property tax and insurance payments even though they are not receiving payments from the borrowers.”
Time-related costs of foreclosure have escalated everywhere since the housing crisis, but especially in judicial states. Prior to the crisis, time-related costs accounted for an average of 12 percent of total foreclosure costs: 16 percent in judicial states and 10 percent in non-judicial. Since the housing crisis, time-related foreclosure costs have soared by 67 percent on the average up to 20 percent of all foreclosure costs with both judicial and non-judicial states figured in. The percentage of increase has been greatest in judicial states, where time-related foreclosure costs have spiked by 106 percent since the start of the crisis. In non-judicial states, the increase has been 40 percent.
“To make matters worse, some research finds that the longer timelines associated with judicial reviews do not, in fact, produce better outcomes for borrowers and may even make late-stage modifications less likely,” Freddie Mac stated in the report. “Other research documents the negative impact on neighborhoods of lengthy delays in liquidation.”
Deficiencies and weaknesses in the foreclosure process and the process of servicing non-performing loans were exposed by the housing crisis; robo-signing and foreclosure on homes of active military personnel serving overseas have led to widespread public outrage as well as multi-billion dollar settlements.
“These shortcomings provide a reminder that distressed borrowers are in a vulnerable situation and merit legal protection,” Freddie Mac stated. “However, the lengthy delays that are common in some judicial states may be just as damaging. These delays increase losses to lenders and financing costs to borrowers. Moreover, they tend to drag out the healing process in the wake of the housing crisis. States must be thoughtful in finding ways to balance the need to protect distressed borrowers with the equally compelling need to support a well-functioning housing system.”

Call Justin @ 541-543-7287