Foreclosure Starts Plunge to Lowest in Nearly a Decade Team Thaywser #realestate #foreclosures #housing #market #ne
Some foreclosure metrics have long been approaching or below pre-crisis levels. Foreclosure starts reached a new low in November, however, falling to their lowest level in nearly 10 years, according to Black Knight Financial Services’ First Look at Mor

tgage Data for November 2015 released Wednesday.
November’s total of 66,600 foreclosure starts was the lowest total for one month since April 2006, about two and a half years before the beginning of the housing crisis. The total represents a 9 percent decline from October and nearly a 10 percent decline from November 2014, according to Black Knight. Foreclosure inventory was also way down in November, falling by about 185,000 properties year-over-year down to about 698,000—or approximately 1.38 percent of all residential mortgages in the U.S.
While foreclosure starts were steadily declining, however, the number of both 30- and 90-day delinquencies experienced seasonal upticks. The total of mortgage loans that were 30 days overdue but not in foreclosure increased by about 76,000 over-the-month up to about 2.49 million, or 4.92 percent of all mortgages. Despite the monthly increase, that total fell by more than half a million (546,000) year-over-year, according to Black Knight. Concurrently, the number of mortgages that were 30 days or more overdue or in foreclosure rose by about 53,000 from October to November, up to 3.2 million. Despite the monthly increase, that number represented a year-over-year drop of nearly three-quarters of a million (732,000)/
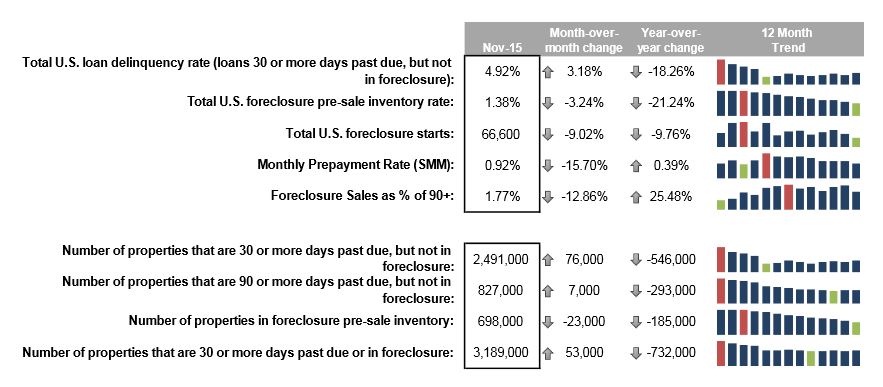 The number of residential mortgage loans 90 days or more delinquent but not in foreclosure ticked up from October to November by about 7,000 properties, up to about 827,000, according to Black Knight. That total declined year-over-year by more than a quarter of a million, however (293,000).
The monthly pre-payment rate, which is normally a good indicator of refinance activity, inched upward year-over-year by 0.4 percent but took a substantial tumble from October to November of about 16 percent, down to 0.92 percent, according to Black Knight.
